
There are quite a few monitoring tools out there that can benefit you in your environment, but if you want to capitalize on robust alerting and monitoring within the Azure space, then Azure Monitor is the ideal solution to use.
Azure Monitor will allow your organization to use a central solution to store and analyze operational telemetry from your on-prem and cloud environments. In addition, one of the best features of Azure Monitor is the ability to scale on-demand and is optimized for performance as it integrates with various tools in Azure. Below are a few examples that Microsoft goes over of what you can do with Azure Monitor and a diagram that gives a high-level architecture view. Microsoft also goes more in-depth with a video explaining an earlier version of the diagram, but the explanations are still relevant.
Azure Monitor overview – Azure Monitor | Microsoft Docs
- Detect and diagnose issues across applications and dependencies with Application Insights.
- Correlate infrastructure issues with VM insights and Container insights.
- Drill into your monitoring data with Log Analytics for troubleshooting and deep diagnostics.
- Support operations at scale with smart alerts and automated actions.
- Create visualizations with Azure dashboards and workbooks.
- Collect data from monitored resources using Azure Monitor Metrics.
- Investigate change data for routine monitoring or for triaging incidents using Change Analysis.
Referenced Diagram from Azure Monitor overview – Azure Monitor | Microsoft Docs
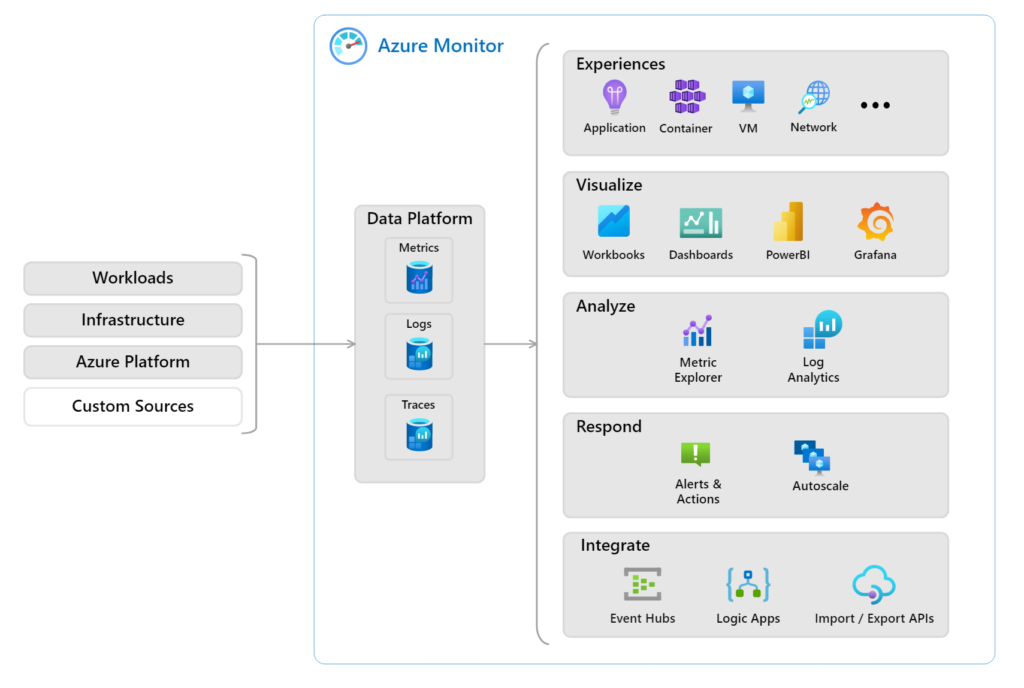
As you see in the diagram above, Azure Monitor collects metrics and logs to perform analysis and alert generation. It receives this data from target resources and then gives you a visualized view at a high level with Workbooks, Dashboards, PowerBI reports, and Grafana. One of Microsoft’s good features with some areas inside Azure is that it gives you a quick video to help you better understand the product. For example, below, if you want to learn quickly about Log Analytics and the benefits it can give you, Azure typically will provide you with some quick tips and links to learn more about the features.
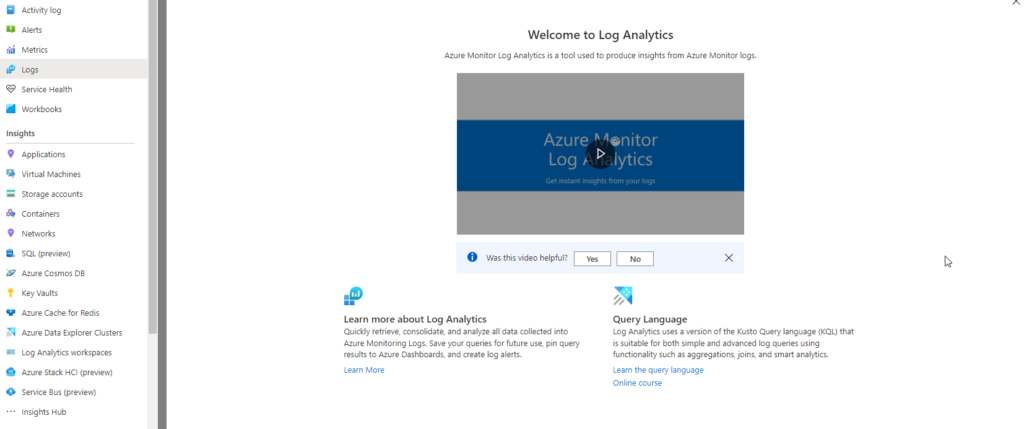
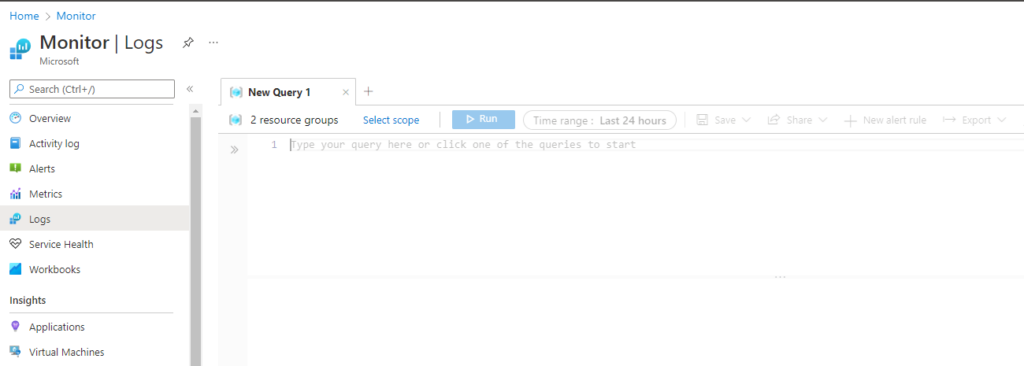
Log Analytics is a tool in the Azure Portal that allows you to edit and run log queries from the data that Azure Monitor collects. It uses the Kusto Query Language (KQL), similar to SQL commands. You can also get IntelliSense which can help auto-complete the names of tables that you are trying to query. I have provided a few links below to help you better understand the Kusto Query Language (KQL).
Kusto Query Language (KQL) overview- Azure Data Explorer | Microsoft Docs
Recommended course by Microsoft to take if you have a Pluralsight subscription:
Kusto Query Language (KQL) from Scratch | Pluralsight
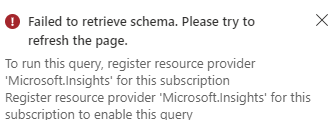
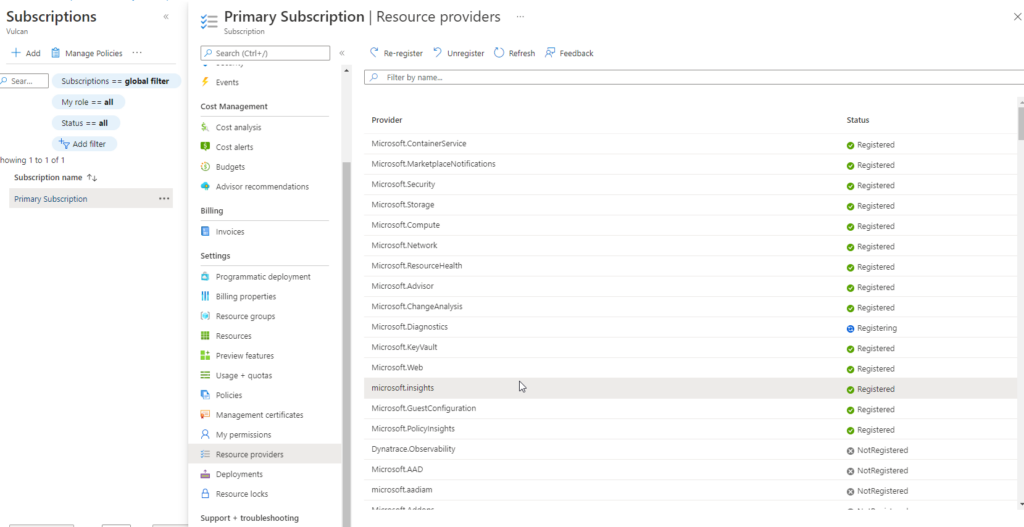
If you are trying to test this out in your environment and you get the error below follow these steps to fix it.
Go to Subscriptions – Your Subscription – Resource Providers – Look for Microsoft.insights – Register
You can then start querying.
As mentioned above, Log Analytics is a service within Azure Monitor, and I provided below a more in-depth explanation of the tool.
Overview of Log Analytics in Azure Monitor – Azure Monitor | Microsoft Docs
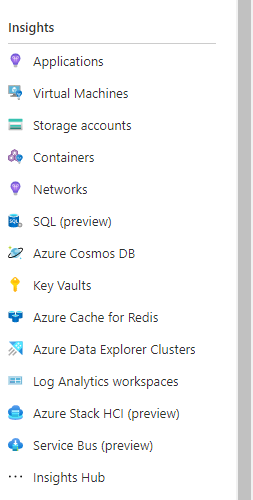
Application Insights is another feature of Azure Monitor that provides you with application performance management and monitoring for live web apps. This is incredibly useful for Developers and DevOps professionals that help with detecting performance anomalies and use analytics tools to help continuously improve performance and usability. I have provided a screenshot below of where you can find Insights within Azure Monitor.
In 2018, Microsoft combined Log Analytics and Application Insights into a single service called Azure Monitor. This provides you with a centralized location for all your monitoring needs when it comes to
- Application monitoring data
- Guest OS monitoring data
- Azure resource monitoring data
- Azure subscription monitoring data
- Azure tenant monitoring data
If you are unsure of using Azure Monitor, I would highly recommend that you look at trying it out for free and see how it can benefit you in your environment. I have provided the link below.
Azure Monitor Pricing
Pricing – Azure Monitor | Microsoft Azure
Azure Monitor is becoming the All-in-One monitoring tool for many different organizations with all its features. Whether detecting and diagnosing issues across applications using Application Insights or drilling into your monitoring data with Log Analytics, Azure Monitor offers a scalable solution to keep your environment running at peak performance. Once your data is collected from the monitored resources, you can use Azure Monitor Metrics and create dashboards and workbooks to analyze and make changes that fit your business. Azure Monitor gives you the ability and customization tools that make a great choice to monitor your data in the cloud.
If you have any questions, feel free to reach out, we would love to assist you!