
There are many reasons why your database queries can start to lag or experience throughput issues. In this article I will do troubleshooting on two common issues with slow queries and a way to fix each one. When doing any performance tuning on a database it’s important to do a vast amount of research first before making any changes to your database.
I will be going over three steps you need to take in order to fix slow queries in MongoDB.
Troubleshooting Steps
- Identifying the problem.
- Fixing the problem.
- Ways to avoid encountering the problem again.
Response Time Degradation (Slow Response Time)
Working Set Is Larger Than Allowed RAM
Your working set is the amount of data and indexes that will be active and in use by your instance. If you have a particularly large system, you need to figure out what parts of your data are most used before you’re able to determine what your working set will be. If this is a particularly new instance, figuring out the growth of your system over a year will help you determine how much RAM to assign for your cache size.
Identify
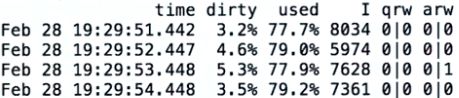
First you will want to run mongostat.
mongostat –port 27001 -o “time=time, dirty=dirty,used=used,insert=I,qrw=qrw,arw=arw”
Focus on the columns “dirty” and “used”. These two columns should be relatively the same in an optimal environment. If the “used” column is a significantly higher percentage than your “dirty” column, then you have not allowed enough RAM for your instance.
Fix
This can be fixed by setting your cache size higher. In your config file set the cacheSizeGB to the required amount for your working set.
Storage:
wiredTiger:
engineConfig:
cacheSizeGB:
Avoid
Properly plan out your mongoDB instance and also account for large changes in the system while you’re in maintenance mode or during downtime. If a change is going into your system that will significantly impact your working set size, always remember to account for this with increasing your RAM and then setting cacheSizeGB to accommodate.
Increased Query Time with Growing Data Set
As your data set grows your response time shouldn’t increase that much. There may be a small increase but it should not be linear with growth.
Identify
Let’s say we have a shopping database with a customers collection. Inside this customers collection, we want to find all customers that reside in the city of Orlando. Your end users have been reporting that this type of query has taken longer and longer to return. In order to diagnose, we need to run an explain plan on the query.
db.customers.find({city: “Orlando”}).explain(“executionStats”)
Scroll down to the executionStats and look inside for nReturned, executionTimeMillis and totalDocsExamined.
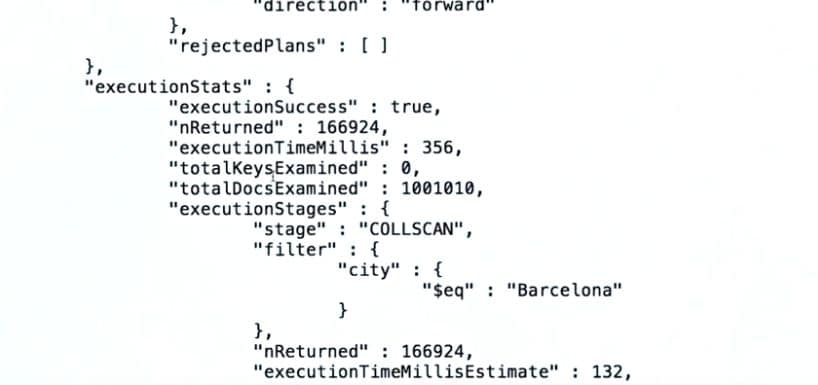
Your nReturned shouldn’t be extremely lower than your totalDocsExamined and your executionTimeMillis should be lower.
If you look down a little further inside executionStages you will find stage. This stage should not read “COLLSCAN”; this means a collection scan was performed and an index wasn’t used.
Fix
To fix this issue, you will want to create an index on the customers collection for the city field.
db.customers.createIndex({city: 1})
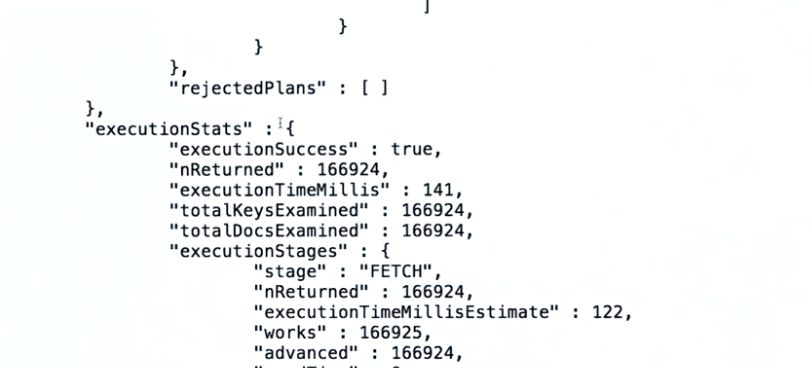
Once this index is created, you can run the explain plan again on your query and you should notice that your stage is now “fetch”, your nReturned matches or is significantly closer to your totalDocsExamined and your executionTimeMillis is lower.
Avoid
Create your indexes when you create the collection. This won’t always be the case, but you can mitigate a lot of headaches by properly planning what data your collection will contain and how that collection will be queried.
For more troubleshooting help you can checkout the Mongo Docs or get help from a Virtual-DBA expert.