
What are Statistics?
Statistics are exactly what the name implies. They are statistical information about the distribution and/or correlation of data in the first specified column of indexes or tables in the form of a histogram. Histograms measure the frequency of which a value occurs within a data set.
There are two types of statistical information used when creating the histograms, distribution and correlation. Distribution Statistics refers to how values are distributed in the columns of a table or index. Correlation Statistics, also known as densities, contain the number of distinct rows/values in a column. This helps determine the number of duplicated values between columns. Correlation statistics are collected when more than one column from the same table is specified. These statistics are usually automatically generated when a query is compiled by the query optimizer and when an index is created/rebuilt. A user defined statistic can be created by using the CREATE STATISTICS statement without an index.
The following is an example of the data contained in a histogram.
DBCC SHOW_STATISTICS ("AdventureWorks2012.Person.Person",IX_Person_LastName_FirstName_MiddleName) WITH HISTOGRAM;
GO 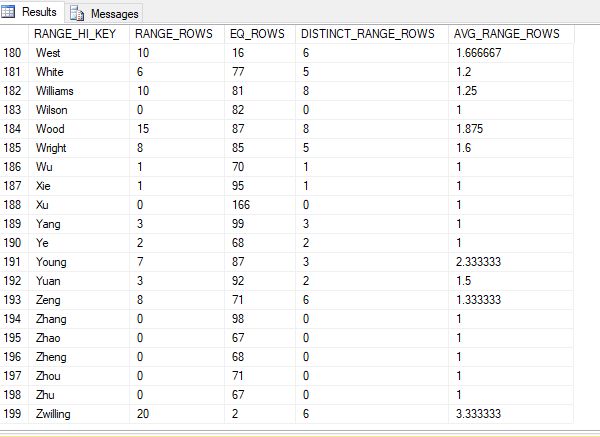
Breakdown of the data in Step 199:
Select LastName
from AdventureWorks2012.Person.Person
where LastName > 'Zhu' and LastName <= 'Zwilling'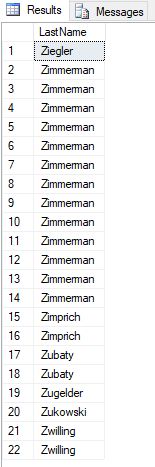
- RANGE_HI_KEY: This is the highest value for each histogram step. This is also known as the key value. For step 199, the key value is Zwilling.
- RANGE_ROWS: Estimated number of rows whose data value falls within that histogram step. This does not include the key value. In the result set listed above, 1-20 are not Zwilling. This means the value for this is 20.
- EQ_ROWS: Estimated number of rows whose data value equals the key value of that histogram step. 2 of the values in the result set above are equal to Zwilling. This value is 2.
- DISTINCT_RANGE_ROWS: Estimated number of rows with a distinct data value within that histogram step. This does not include the key value. In the result set above, there are only 6 distinct values. The value will be 0 if all the values in that step are equal to key value. A good example is step 198. There are 67 values equal to ZHU in column EQ_ROWS, but no values below this are indicated in the column RANGE_ROWS.
- AVG_RANGE_ROWS : Average number of rows with duplicate column values within a histogram step. This does not include the key value. The calculation to determine this number is (RANGE_ROWS / DISTINCT_RANGE_ROWS for DISTINCT_RANGE_ROWS > 0). Example using step 199 from the photo above. 6 is greater than 0, so we divide 20 by 6. This gives us 3.333333… If DISTINCT_RANGE_ROWS is not greater than 0, the AVG_RANGE_ROWS is 1.
Why are Statistics important?
Before going into battle in a video game, it is probably not a good idea to just rush out into an unknown area guns blazing with only an end goal in mind. It is important to make a plan first. To make a plan, one must use the information they have on hand to determine the best steps. What happens if that information is out of date and wrong? That could result in delays, mishaps, or death.
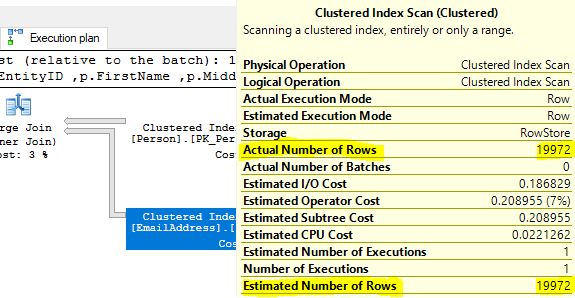
This also applies to SQL Server. The histogram is used to determine cardinality, number of rows in a query set. SQL Server uses the cardinality as a factor to help determine the best query plan. If the statistics are out of date and wrong, the query optimizer is creating a plan using misinformation which could result in it not choosing the optimal query plan. When the wrong plan is implemented in a video game, it could result in the player having to repeat that level until the correct plan is implemented or it results in wasted time and resources to complete the level. This would greatly impact query performance.
There are three useful undocumented trace flags to view the statistics which the query optimizer considers and uses when a query plan is executed; however, we do not recommend using these trace flags in production unless the user is very comfortable with them.
- Trace Flag 9292 produces a list of statistics that the query optimizer considered. These appear after “Stats header loaded:”
- Trace Flag 9204 produces a list of statistics that were fully loaded and used by the query optimizer. These appear after “Stats loaded:”.
- Trace Flag 3604 forces the results of the two previously stated trace flags to appear under the messages tab in SSMS. This should be enabled in addition to the two previously mentioned.
These are great to use when testing a query in a development environment. It allows the user to view more information on what is occurring when a query is executing when combined with viewing the execution plan. This can assist the developer with optimizing a query. These trace flags can also be used to troubleshoot a slow running query.
Example:
SELECT
       p.BusinessEntityID
      ,p.FirstName
      ,p.MiddleName
      ,p.LastName
      ,p.Suffix
      ,p.EmailPromotion
      ,e.EmailAddress
FROM [AdventureWorks2012].[Person].[Person] as p
JOIN [AdventureWorks2012].[Person].[EmailAddress] as e on p.BusinessEntityID = e.BusinessEntityID
OPTION (querytraceon 9292,querytraceon 9204,querytraceon 3604)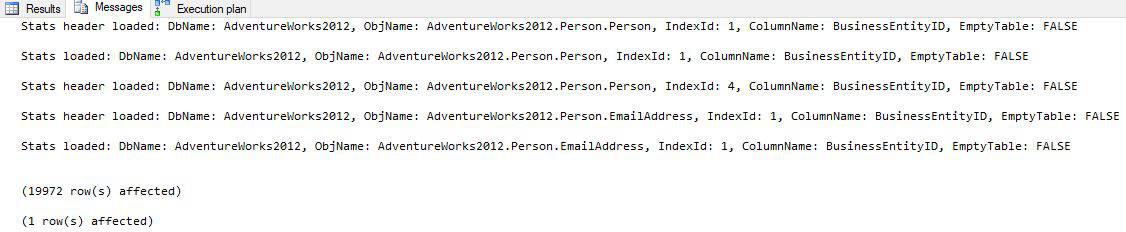
How can Statistics be maintained?
Statistics should be updated as often as possible.
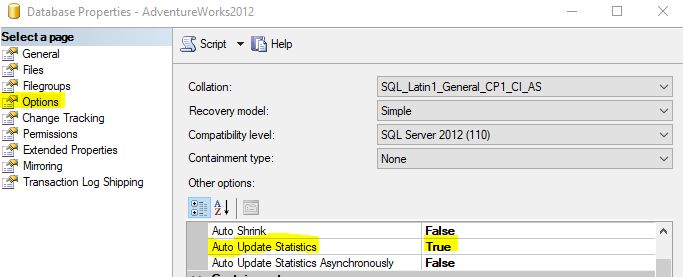
Enabling AUTO_UPDATE_STATISTICS could help keep statistics up to date. Before compiling a query and before executing a cached query plan, the query optimizer determines if it considers the statistics stale or not. If the statistics are stale, it updates the statistics and recompiles the query. Prior to SQL Server 2016, the setting uses the following criteria to determine if a table’s statistics are stale.
- If the table cardinality was 500 or less at the time statistics were evaluated, update for every 500 modifications.
- If the table cardinality was above 500 at the time statistics were evaluated, update for every 500 + 20 percent of modifications.
Using a fixed percentage of rows modified means that larger tables can have out of date statistics for long periods of time until enough modifications have been made. Starting in SQL 2016 statistics are automatically updated in much more aggressive manner. For versions prior to 2016 there are 2 approaches to keeping indexes in a more updated state.
The first is by enabling Trace Flag 2371. Prior to SQL Server 2016, AUTO_UPDATE_STATISTICS used a fixed threshold to determine when statistics are considered stale as shown above. Trace Flag 2371 changes this to a dynamic threshold. The larger the table, the lower the percentage threshold is. This is done through the engine in SQL Server 2016 and later, so the trace flag does not affect this version. More information on this trace flag can be found here.
The second option is adding a scheduled job that will manually update the statistics. This option will also reduce the number of recompilations since the statistics will less likely be stale when the query optimizer analysis it. It is also highly recommended to add a job if filtered indexes are added. AUTO_UPDATE_STATISTICS does not have much effect on filtered statistics because the threshold is based on a percentage of the whole table instead of the subset used by the filtered index. Because of this, filtered statistics aren’t always auto updated when they become stale. This job could cause overhead and take a while to run. Because of this, we recommend scheduling this job to run after hours. For version prior to SQL Server 2016, this option should be done in conjunction with enabling Trace Flag 2371 and on its own for SQL Server 2016 and later.
When creating a statistic, a filtered predicate could be added. These are called filtered statistics. When two tables are joined, the estimated cardinality can return greater than the actual number of rows requested. Because the estimated cardinality is inaccurate, SQL Server can not accurately choose the best plan. Filtered statistics can be used to resolve this error. They are created by adding a where clause to the CREATE STATISTICS statement.
Example using AdventureWorks2012:
CREATE STATISTICS ContactPromotion1
    ON Person.Person (BusinessEntityID, LastName, EmailPromotion)
WHERE EmailPromotion = 2;
GO
If the update statistics job is taking a while to run and causing blocking, it could be beneficial to cleanup automatically created statistics. Because the query optimizer might create statistics that a query needs before each run, the number of statistics on a database can steadily increase until they are cleaned up. This includes runs of test queries. This becomes a problem when the table undergoes a lot of changes. Each statistic will need to be updated which can be costly. It is recommended to periodically check the statistics and drop the ones that are not being used. If the instance/database is being migrated or upgraded, it could be beneficial to drop all auto created statistics and start with a clean slate. Dropping statistics could create overhead, so it is recommended to do this after hours. In addition, it could cause queries to temporarily take longer to run until the needed statistics are automatically recreated.