The number one priority in any production environment, beyond availability, is performance. End users want a smooth and quick experience, while the pressure mounts on you to deliver faster response times. Since PostgreSQL monitoring is arguably one of the most immature aspects of the platform, you’ll be relying heavily on third-party solutions. You will soon realize that there isn’t a one-shot solution for monitoring and that you will most likely have to combine multiple tools to get a good look at your ecosystem. In this post, I will discuss two of the tools available for monitoring PostgresSQL: pganalyze and pgwatch2.
pganalyze
Pganalyze, from the company of the same name, is a great tool that tracks query runtime, performs health checks, gives system advice and analyzes log output. They offer several plans at different price points as well as a limited free developer license which can be used for a single server. The pricing is reasonable if you want hassle-free setup and to hit the ground running with your monitoring.
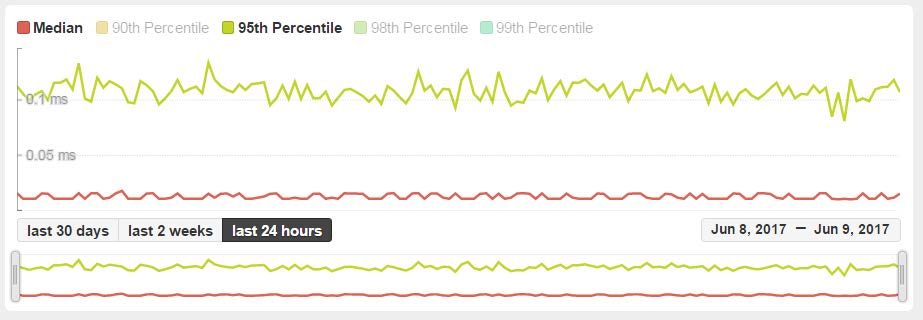
Query Runtime
This view gives you an idea at what point in the day any degradation is occurring. You’re able to filter by percentile by clicking the legend at the top and specifying the time range between 30 days, 2 weeks and 24 hours. You can also specify a date range by using the date on the bottom right.
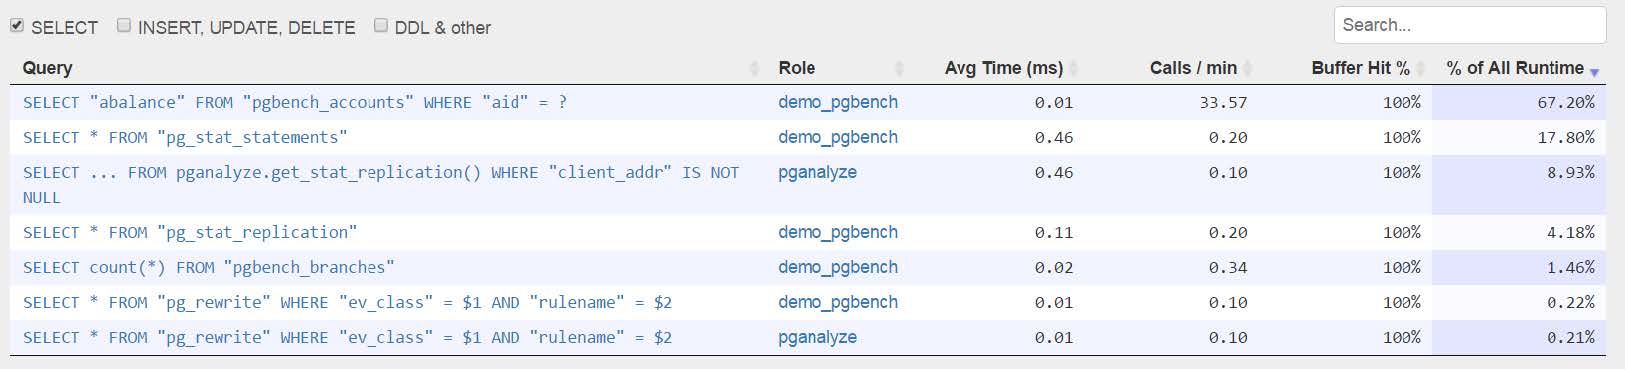
Query Statistics
This grid is a summary of your queries. You’re able to filter these by query type, search the grid for keywords and sort the columns. It gives you a heads-up display for avg time, calls per minute, buffer hit percentage and a percentage of total runtime.
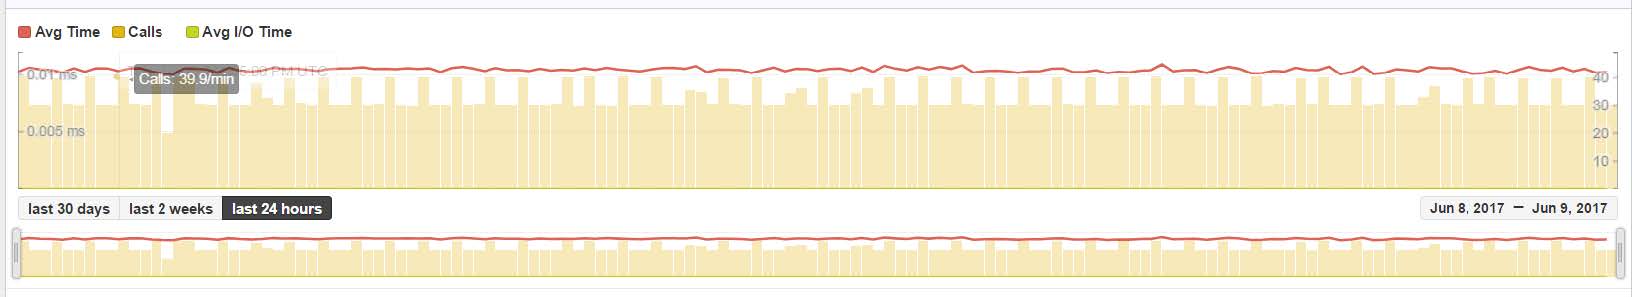
You can click into any query in the list to see details about the query performance. The following grid details a slot of time specified by the 3 buttons between the upper and lower graph. The top graph is filtered by the sliders in the lower graph, to allow further specific detail. You can filter the data you see by avg-time, calls and avg i/o time.
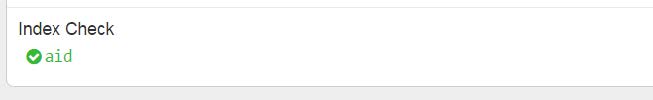
Also on this page you can view the indexes that are being used by the table. You can click on an index and it will bring you to performance details on the index.
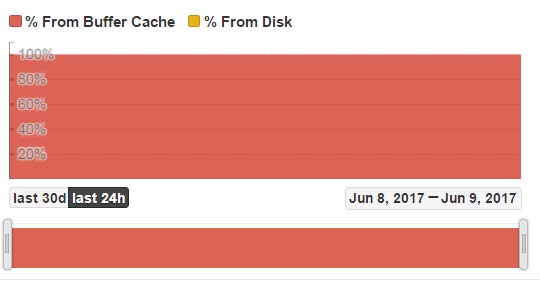
The most important statistic from this page is the buffer cache. If you’re seeing any % from disk usage, it may be an indication that you’re having memory issues.
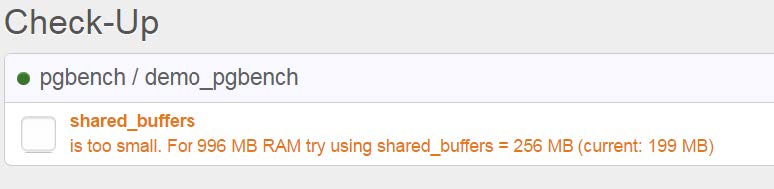
Health Check
There is a section of pganalyze that does a health check on your system and gives you recommendations for system and database configuration. You can click on the recommendation and it will give you more detail about the issue.
Pganalyze offers many more options and information but this highlights some of the main points for monitoring your system.
Pgwatch2
Pgwatch2 is a very robust open source solution offered by Cybertec. This tool doesn’t require any modifications to the database and metrics are easily customized. The data is stored in InfluxDB.
Pgwatch2 is very easy to install if you’re using docker. Simply run a command line through their quickstart guide at the bottom of this page. There are endless customization possibilities through using InfluxQL.
http://www.cybertec.at/en/products/pgwatch2-next-generation-postgresql-monitoring-tool/
Grafana
This is the visual tool for pgwatch2. It allows you to set up dashboards and track metrics to your liking.
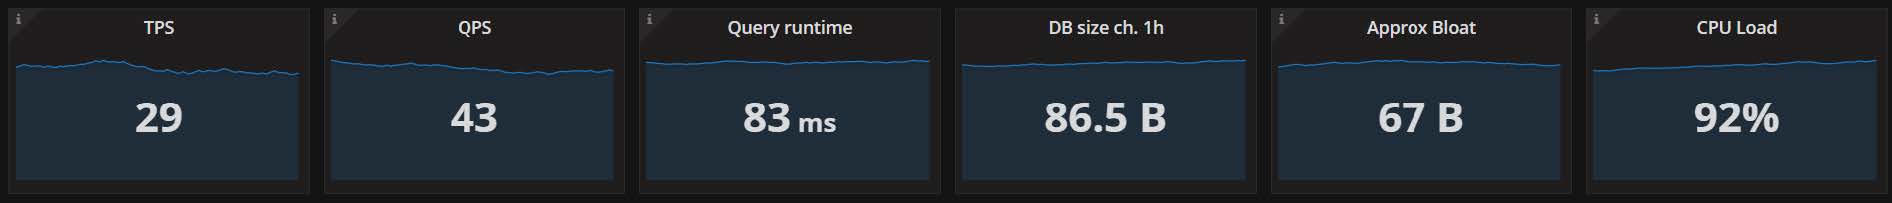
The default dashboard will track many unique metrics that are useful to your environment. You can see the average query time, cpu load etc.
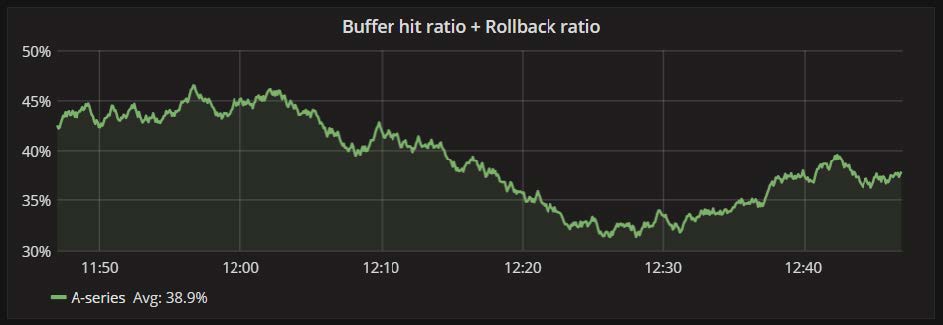
Several graphs are at your disposal with the basic installation. One of those graphs is the buffer hit ratio. All of these graphs can be adjusted for time range, you can also edit each panel to display a different range or other properties.
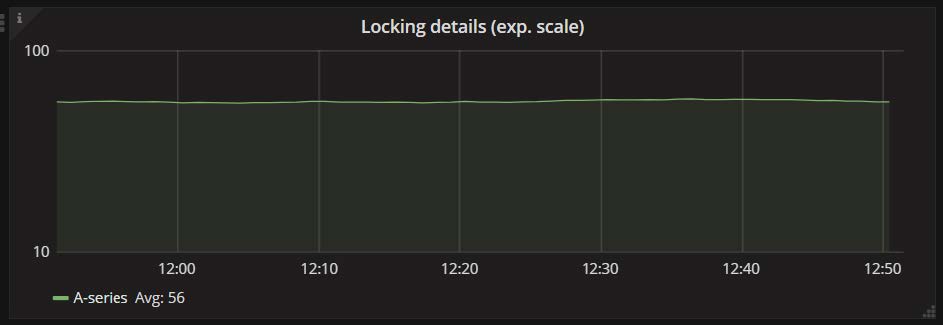
You can track your locking details, by selecting Locking Details from the drop down menu.
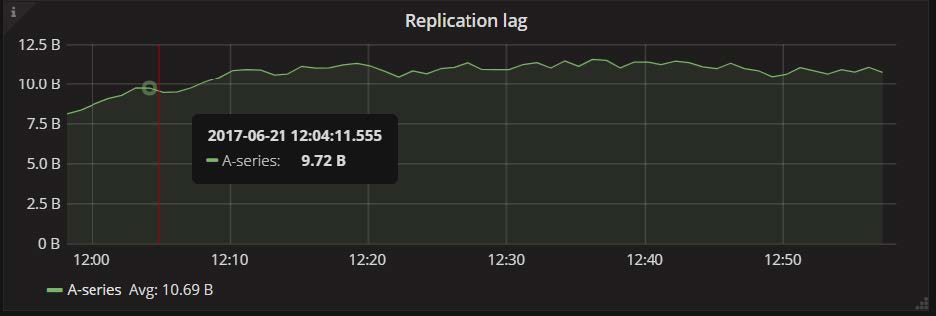
Replication lag is a very important metric to track in a high availability environment.
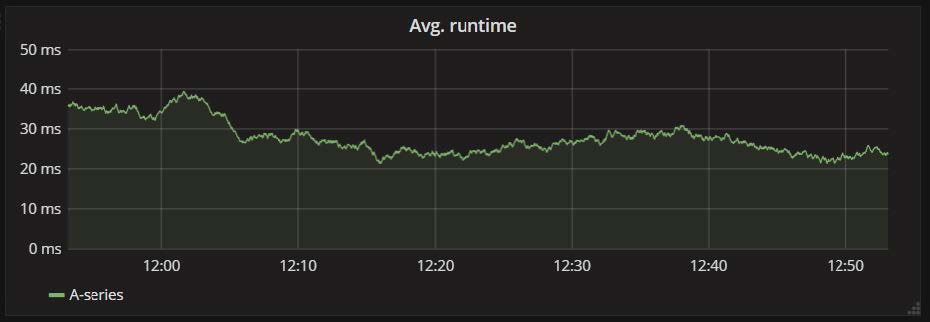
By select Single Query Details you get a vast array of graphs that track your query performance from a quick glance. You can track what time of day you’re getting the worst query performance and isolate issues quickly with the avg runtime graph.
Some other available graphs are Calls, Total Runtime (showing highest query times), Shared Buffers Hit Ratio, Temp Blocks Read/Write ratio, Block Read/Write time (possible disk contention).
While you’ll still have to do some investigative work, these tools can give you a very quick and precise view of your running database. You can use the data available to make future decisions or solve current problems.