My top metric for analyzing database performance is index read efficiency. This metric essentially shows how well indexed a database is for the workload that runs against it. Index read efficiency is calculated by taking the rows read and dividing them by the rows returned. The value tells us, on average, how many rows Db2 had to read in order to return one row – essentially how well indexed this database is for the workload that runs against it. A poor index read efficiency is the number two predictor, after current runstats, of a database that is likely to have performance problems.
Calculating Index Read Efficiency
The values are available in a number of different places to allow you to calculate it at a number of different levels:
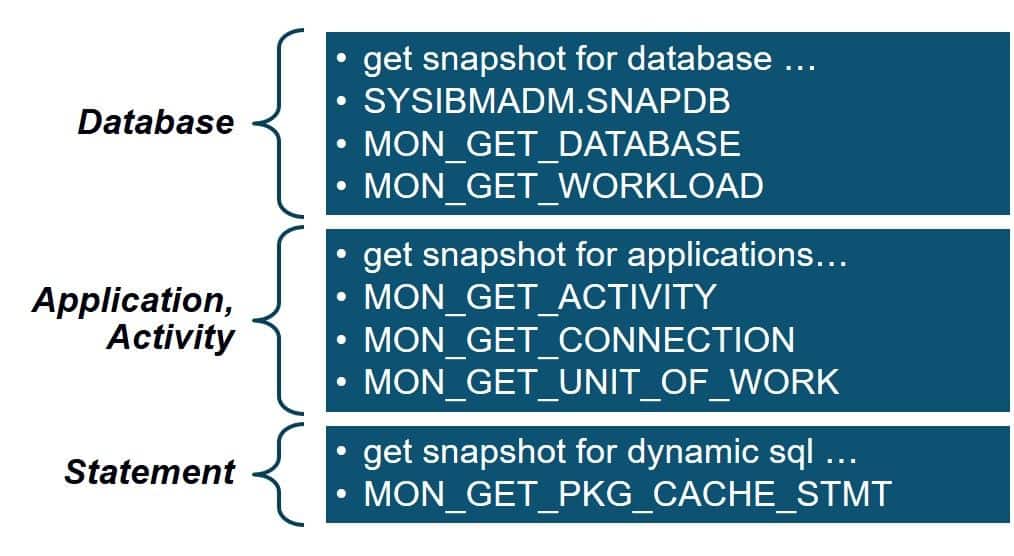
The general calculation at any of these levels is:

Sometimes “Rows Returned” is referred to as “Rows Selected”, depending on the location.
My favorite level to calculate it at is at the database level. Here is a query to calculate index read efficiency at the database level, since the last database activation:
select  case when rows_returned > 0
                then decimal(float(rows_read)/float(rows_returned),10,5)
                else -1
        end as read_eff
from table(mon_get_database(-2))
with ur;
READ_EFF
------------------
          65.79791
  1 record(s) selected.
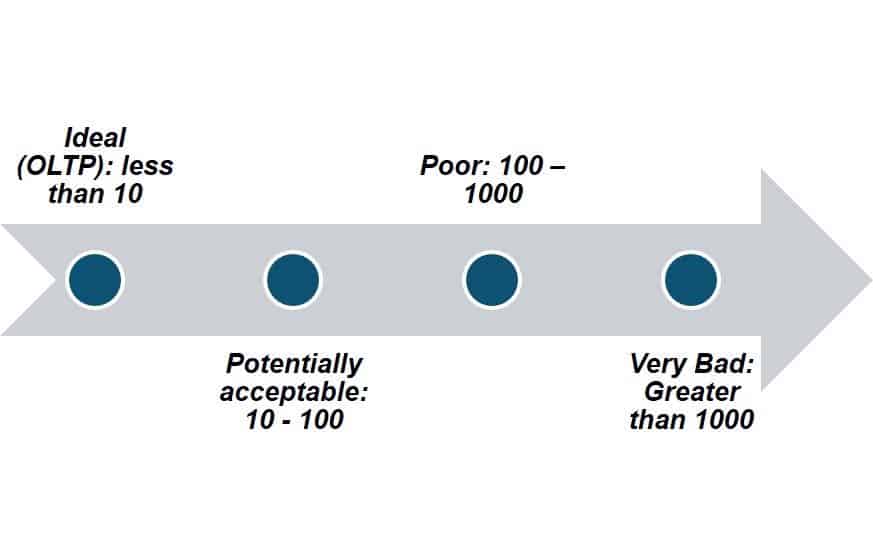
For OLTP or other transaction processing databases, we aim for an index read efficiency of 10 or less. Here is the general spectrum of values:
Improving Index Read Efficiency
The options to improve index read efficiency are much more complicated that calculating the value.Often a DBA will identify problematic SQL. This is a good query against MON_GET_PKG_CACHE_STMT to use:
WITH SUM_TAB (SUM_RR, SUM_CPU, SUM_EXEC, SUM_SORT, SUM_NUM_EXEC) AS (
        SELECT  FLOAT(SUM(ROWS_READ)),
                FLOAT(SUM(TOTAL_CPU_TIME)),
                FLOAT(SUM(STMT_EXEC_TIME)),
                FLOAT(SUM(TOTAL_SECTION_SORT_TIME)),
                FLOAT(SUM(NUM_EXECUTIONS))
            FROM TABLE(MON_GET_PKG_CACHE_STMT ( 'D', NULL, NULL, -2)) AS T
        )
SELECT
        SUBSTR(STMT_TEXT,1,10) as STATEMENT,
        ROWS_READ,
        DECIMAL(100*(FLOAT(ROWS_READ)/SUM_TAB.SUM_RR),5,2) AS PCT_TOT_RR,
        TOTAL_CPU_TIME,
        DECIMAL(100*(FLOAT(TOTAL_CPU_TIME)/SUM_TAB.SUM_CPU),5,2) AS PCT_TOT_CPU,
        STMT_EXEC_TIME,
        DECIMAL(100*(FLOAT(STMT_EXEC_TIME)/SUM_TAB.SUM_EXEC),5,2) AS PCT_TOT_EXEC,
        TOTAL_SECTION_SORT_TIME,
        DECIMAL(100*(FLOAT(TOTAL_SECTION_SORT_TIME)/SUM_TAB.SUM_SORT),5,2) AS PCT_TOT_SRT,
        NUM_EXECUTIONS,
        DECIMAL(100*(FLOAT(NUM_EXECUTIONS)/SUM_TAB.SUM_NUM_EXEC),5,2) AS PCT_TOT_EXEC,
        DECIMAL(FLOAT(STMT_EXEC_TIME)/FLOAT(NUM_EXECUTIONS),10,2) AS AVG_EXEC_TIME
    FROM TABLE(MON_GET_PKG_CACHE_STMT ( 'D', NULL, NULL, -2)) AS T, SUM_TAB
    WHERE DECIMAL(100*(FLOAT(ROWS_READ)/SUM_TAB.SUM_RR),5,2) > 10
        OR DECIMAL(100*(FLOAT(TOTAL_CPU_TIME)/SUM_TAB.SUM_CPU),5,2) >10
        OR DECIMAL(100*(FLOAT(STMT_EXEC_TIME)/SUM_TAB.SUM_EXEC),5,2) >10
        OR DECIMAL(100*(FLOAT(TOTAL_SECTION_SORT_TIME)/SUM_TAB.SUM_SORT),5,2) >10
        OR DECIMAL(100*(FLOAT(NUM_EXECUTIONS)/SUM_TAB.SUM_NUM_EXEC),5,2) >10
    ORDER BY ROWS_READ DESC FETCH FIRST 20 ROWS ONLY WITH UR;
Sample output:
STATEMENT  ROWS_READ            PCT_TOT_RR TOTAL_CPU_TIME       PCT_TOT_CPU STMT_EXEC_TIME       PCT_TOT_EXEC TOTAL_SECTION_SORT_TIME PCT_TOT_SRT NUM_EXECUTIONS       PCT_TOT_EXEC AVG_EXEC_TIME
---------- -------------------- ---------- -------------------- ----------- -------------------- ------------ ----------------------- ----------- -------------------- ------------ -------------
SELECT ACA              5671140      81.71               657030        1.13                 1422         0.76                       0        0.00                 1860         6.92          0.76
WITH SYSIB               865658      12.47              1813570        3.12                 2903         1.56                       4        4.04                  214         0.79         13.56
select sna                62808       0.90                17975        0.03                   29         0.01                      13       13.13                   16         0.05          1.81
CALL SYSIB                 9418       0.13             17493719       30.18                45506        24.50                       0        0.00                 2121         7.89         21.45
SELECT T.t                 6600       0.09               383749        0.66                  617         0.33                      62       62.62                 2200         8.18          0.28
select str                 4353       0.06                52841        0.09                24344        13.10                       2        2.02                    3         0.01       8114.66
CALL SYSIB                   41       0.00             34754421       59.97                61356        33.03                       0        0.00                 2949        10.97         20.80

  7 record(s) selected.
Though complicated, this query helps to identify queries that are a problem in terms of key database resources and reports their impact as a percentage of that resource used by all other queries in the package cache. The queries in this result set with a high percentage of rows read are most likely to be negatively impacting the index read efficiency for the database.
After identifying the problematic queries, these are the most common actions to take to improve query performance and index read efficiency:
- Analyze that SQL and then
- Add or remove indexes to help the query run faster
- Rewrite the SQL to be more efficient
- Consider special statistics methods like column group statistics or statistical views
- Work with developers to reduce the frequency of execution (through application-level caching or other methods)
- Work with developers to change or improve the query
- Work with developers to otherwise change the database design
Summary
Often, you can throw hardware at a database with poor index read efficiency, but this is an inefficient solution, and there are limits to its efficacy. SSD and a lot of memory and CPU resources may temporarily alleviate or mask problems with read efficiency. Sometimes on a database server with poor read efficiency, we can reduce the database’s need for CPU and memory by half or more! The Db2 experts at Xtivia would love to help you reduce hardware costs and improve database performance by working with you to lower index read efficiency.