SUMMARY:
Oracle’s EBS Performance and Statistics Analyzer is a crucial support utility that helps Database Administrators (DBAs) diagnose and enhance the performance of an Oracle E-Business Suite (EBS) database by generating detailed health reports and actionable recommendations. This guide explains how to prepare the environment, download and run the tool, and interpret the results to resolve issues proactively.
- The analyzer must be run from the application tier, not the database tier, and requires the APPS user to have specific grants to access internal data dictionary views.
- The output is an HTML dashboard that categorizes findings by criticality, allowing users to focus on errors and warnings related to database parameters, WebLogic servers, and other configurations.
- Beyond diagnostics, the tool collects valuable point-in-time data, including JDBC connection metrics, recent EBS program performance, and installed product patch levels.
By running this analyzer regularly, such as quarterly or bi-annually, DBAs can stay ahead of performance degradation and maintain a healthy, optimized E-Business Suite environment.
Table of contents
Preparing the APPS User for Analyzer Access
After our initial test run, we discovered that the analyzer expects the APPS user to have specific access to various internal data dictionary views. These grants should be applied in advance:
 CREATE OR REPLACE PUBLIC SYNONYM "V$SYSTEM_PARAMETER2" FOR "SYS"."V_$SYSTEM_PARAMETER2";
 GRANT SELECT ON sys.V_$SYSTEM_PARAMETER2 TO apps;
 GRANT SELECT ON sys.aux_stats$ TO apps;
 GRANT SELECT ON DBA_STAT_EXTENSIONS TO apps;
 GRANT SELECT ON dba_tables TO apps;
 GRANT SELECT ON WRI$_OPTSTAT_TAB_HISTORY TO apps;
 GRANT SELECT ON WRI$_OPTSTAT_IND_HISTORY TO apps;
 GRANT SELECT ON DBA_INDEXES TO apps;
 GRANT SELECT ON DBA_OBJECTS TO apps;
 GRANT SELECT ON sys.V_$CELL_STATE TO apps;
Steps to Use the Analyzer
1. Download Analyzer
Navigate to Doc ID 2126712.1 and download the latest version of fndperf_analyzer_<version>.zip. Transfer it to your EBS Application Server.
2. Validate Version
unzip -p fndperf_analyzer_200.67.zip HAF/resource/fndperf_analyzer.xml | base64 -d -i | grep '<version>'3. Prepare EBS Environment
. EBSapps.env run
env
4. Unzip Analyzer
mkdir /tmp/ebs_analyzer
mv fndperf_analyzer_200.67.zip /tmp/ebs_analyzer/
cd /tmp/ebs_analyzer
unzip fndperf_analyzer_200.67.zip
5. Check Database Connectivity
tnsping [hostname]:[port:default:1521]/[db_service_name]6. Run Analyzer
cd HAF
 bash run_analyzer.sh -Danalyzer="fndperf_analyzer.xml" -DappsCredentials="apps/[password]"
7. Transfer and Review Output
ls -latrh FND*.zip
 cp FNDPERF_*.zip /home/[username]
 unzip FNDPERF_<date>.zip -d /your/local/dir
 open FNDPERF_<date>.html
Important Notes
- Do not run this from the database tier. It must be executed from the application tier due to context file requirements.
- Make sure Java is available and your APPS environment is sourced.
Analyzer Results
Once you open FNDPERF_<date>.html, you will be presented with this Dashboard.
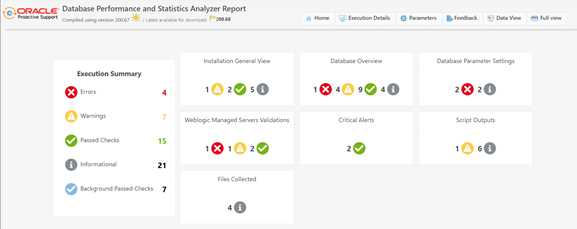
The Executive Summary presents all findings by Criticality, allowing you to navigate and focus on Errors and Warnings.
In our example, we have four errors and seven warnings, divided into categories of :
- Installation General
- Database
- Database Parameters
- WebLogic Managed Servers Validation
- Critical Alerts
- Script Outputs
Clicking on Errors under Executive Summary takes us to the Errors Signature page.
The Menu bar on the left will present the categories of issues to be addressed.

You will see this image on the various screens. This indicates a closed/collapsed section, and you should click it to expand and get more information.
Let’s look at our Mandatory Database Parameters for RDBMS 19.26.0.0.
As you can see, the tool takes into consideration the whole patch level of both the database and EBS, as indicated by the message:
Error: Not all mandatory database parameters are properly set for RDBMS 19.26.0.0.0 and EBS release 12.2.14.
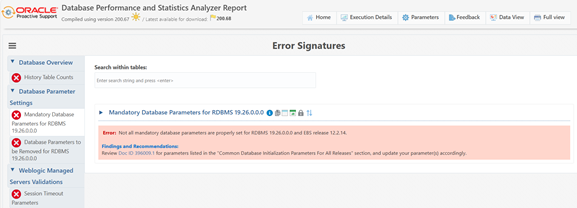
When you first navigate to this page, you cannot see the details as it is collapsed.
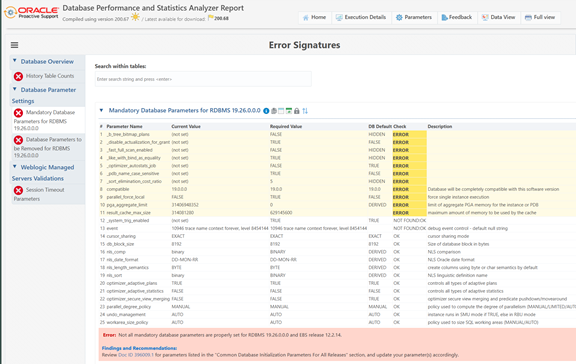
Click on the carrot to expand information and view all version-specific issues.
On all findings, Oracle Support has provided the source for the information under Findings and Recommendations.
In this case, Review Doc ID 396009.1 for parameters listed in the “Common Database Initialization Parameters For All Releases” section.
Now we know that out of our 4 Errors on the Executive Summary Page, One Error is related to improperly configured Mandatory Database parameters for EBS. We see that we have 11 parameters that need correction to fix this one error.
To get back to the Dashboard, click the Home button on the top menu bar.
All Errors and Warnings pages work the same way.
You will see the summary of issues in the left menu pane. Select each one to access its page, and then expand the information. Use the Findings and Recommendations to get to the source documentation that validates these findings.
You should validate and correct these issues until you get a clean dashboard with no errors and warnings, except for any exceptions unique to your environment that might override.
Data View
It turns out that the tool not only analyzes your environment but also collects a large amount of point-in-time data about it, along with backup copies of critical configuration files, including the Context File and WLS config.xml.
A few HIDDEN GEMS in Data View:
It runs and captures results from monitor_jdbc_conn.sql, which provides extensive details on your environment’s JDBC Connections. Here are just a few of the performance metrics it collects on the JDBC:
- Connection Usage Per Module
- Idle connections for more than 3 hours
- Active connections that are taking more than 10 minutes to run
- Statements from JDBC connections taking more than 10 minutes to run
It gathers EBS Program information for the last 15 days, including Maximum Time (in minutes) and execution counts. You can evaluate this to determine where the EBS application performance issues are.
It captures Installed Products with Patch Level and status.
Conclusion
The Oracle EBS Performance and Statistics Analyzer is a powerful diagnostic utility. When combined with proactive tuning and the proper privileges, it provides actionable insights for E-Business Suite database optimization.
XTIVIA recommends adding this analyzer to your quarterly or bi-annual maintenance checklist to stay ahead of performance degradation and support requirements.
For help running the analyzer or interpreting its results, contact our Oracle EBS experts.
Please contact us for any questions.