
What is a deadlock and what exactly does it mean in regards to databases? In order to fully define what a deadlock is, it’s important to note that a ‘lock’ itself occurs when multiple processes are simultaneously trying to access the same resource. A deadlock occurs when two or more of these processes are waiting on one another to give up locks, resulting in neither one being able to make progress because both transactions are contingent on each other releasing their existing lock on the data. And ultimately, neither one will do so prior to acquiring the next. This creates what may appear to be a dead-end or a stalemate, hence the term deadlock.
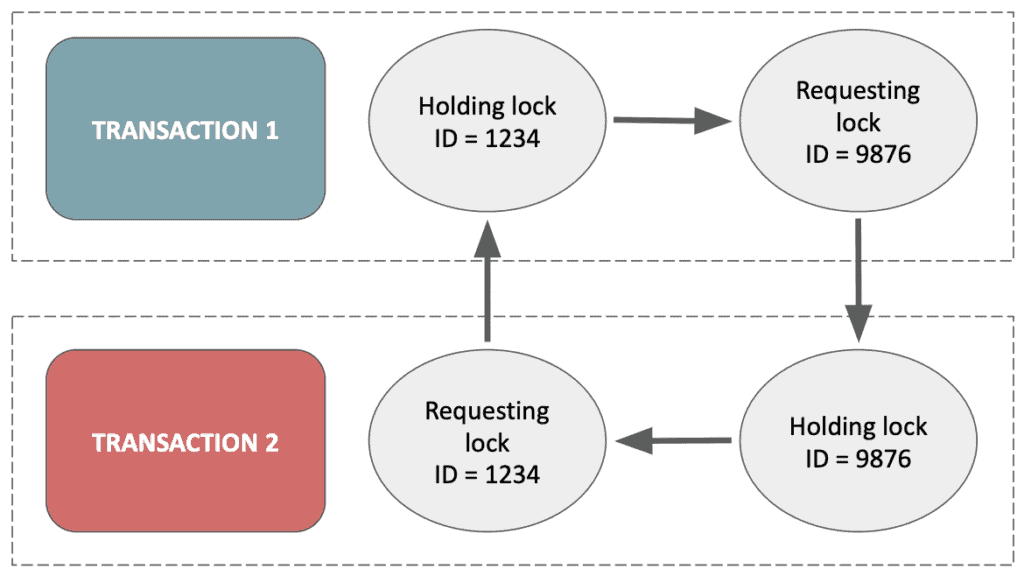
Without intervention, deadlocks become very long running queries and in some storage engines, the query ceases to execute. This can cause performance issues and may even result in a database crash. Deadlocks occur inevitably and there is no real way to prevent one from happening, being that locks are vital to guaranteeing ACID compliant transactions (specifically data consistency). This raises the question: what do we do in this situation and/or how does MySQL handle a never ending cycle of two running transactions conflicting with one another?
Introducing the InnoDB storage engine
With the implementation of the InnoDB engine, MySQL offers a simplified and easy way to diagnose and better understand such deadlocks. The Innodb engine automatically detects it and kills one of the transactions, allowing one transaction to proceed and populating an error on the transaction that was rolled back. This can be found in the error log under the default pathway, /var/log/mysql/mysql.err unless specified otherwise in the config file.
ERROR 1205 (HY000): Lock wait timeout exceeded; try restarting transaction
ERROR 1213 (40001): Deadlock found when trying to get lock; try restarting transaction
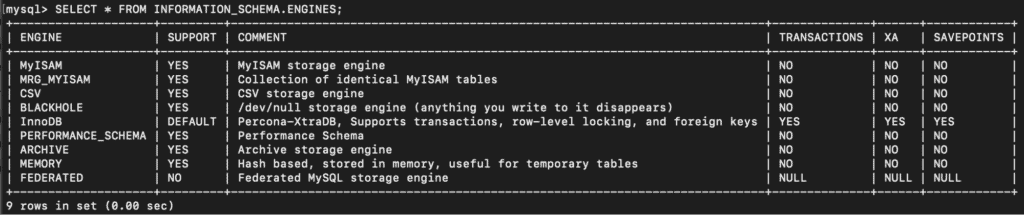
To determine whether or not the server supports innodb, the following commands can be used:
mysql> SELECT * FROM INFORMATION_SCHEMA.ENGINES,
mysql> SHOW ENGINES;
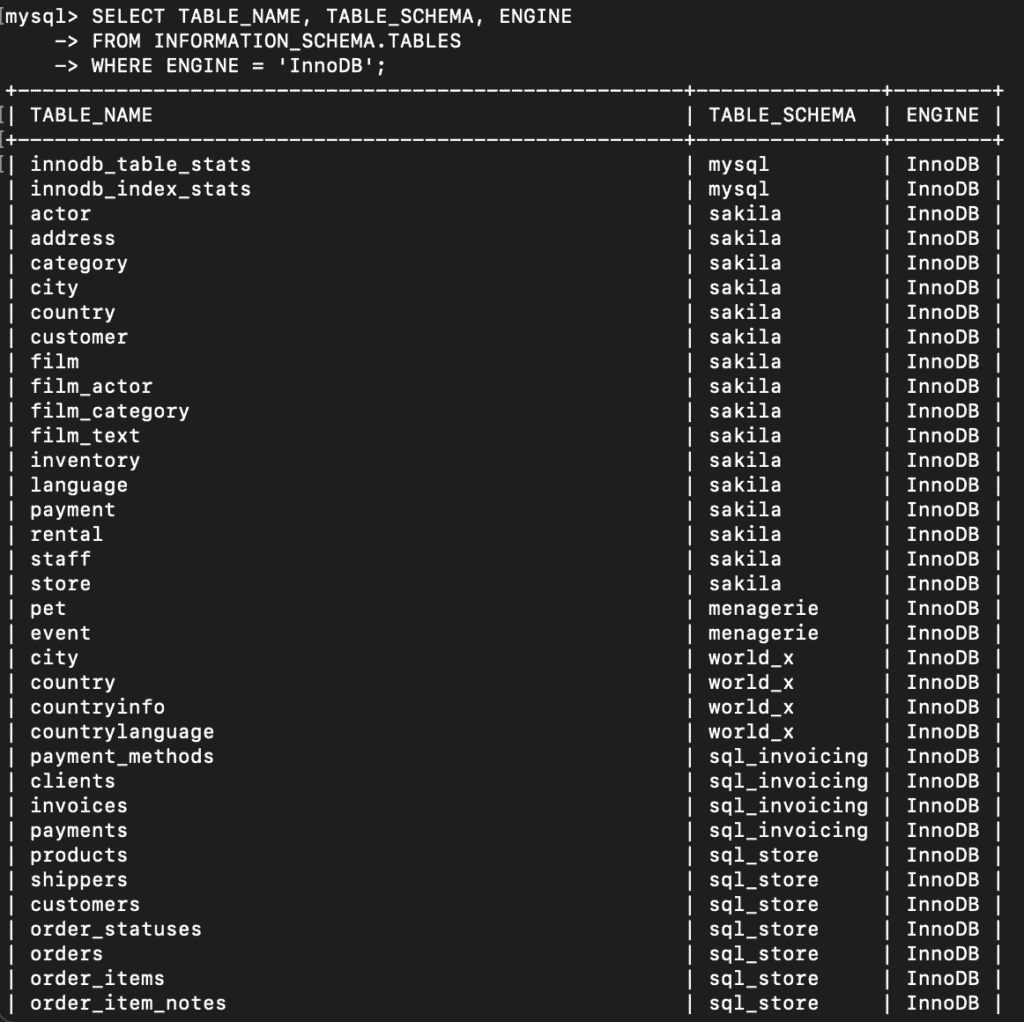
mysql> SELECT table_name, table_schema, engine
mysql> FROM information_schema.tables
mysql> WHERE engine = 'InnoDB';
Deadlock Transactions and the InnoDB Engine
To preface — in order to view these SQL statements causing deadlocks, the MySQL user needs to have been granted the process privilege. This privilege displays information about threads executing within the server. It not only enables the use of the SHOW PROCESSLIST; command but also the SHOW ENGINE; command. Both of which are vital to troubleshooting all sorts of issues in MySQL. In order to check whether or not the user has this privilege, you can run:
SHOW GRANTS FOR CURRENT_USER;
SHOW GRANTS FOR 'root'@'localhost';
And if not, grant that access (if permitted to) using:
GRANT PROCESS, SELECT ON *.* TO 'username'@'%';
FLUSH PRIVILEGES;
And finally, to get a rough idea of what’s going on, we can run:
SHOW ENGINE INNODB STATUS \G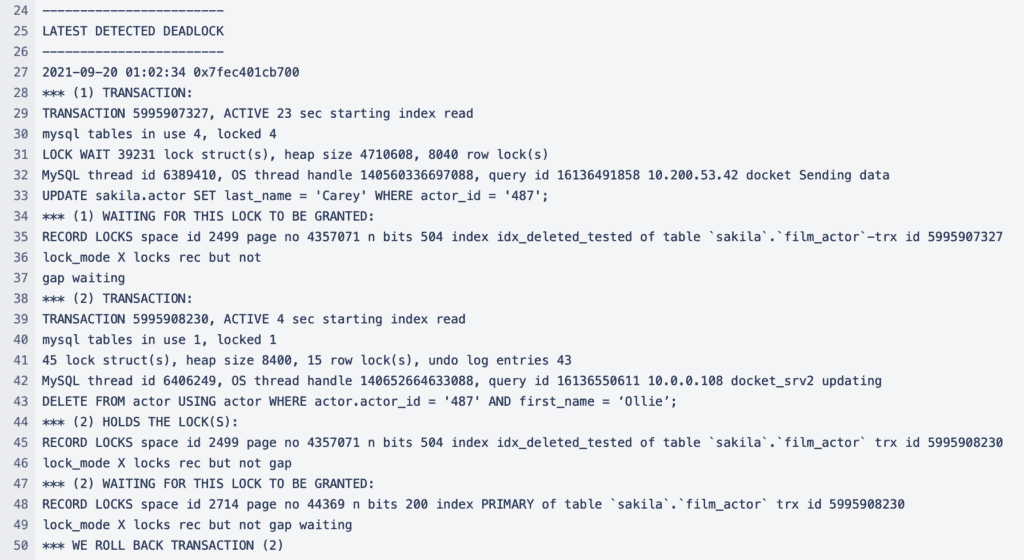
A multitude of information is contained in this command’s output. Knowing how to read it can be useful when debugging problems related to the InnoDB storage engine but what’s under LATEST DETECTED DEADLOCK is where we should focus our attention. Here we can see the details of our deadlock. It’ll show the most recent deadlock including the two conflicting queries and the locks they held. It’ll also inform you of which transaction (one or two) was rolled back and killed after the timeout is reached. The default value of this innodb_lock_timeout variable is 50 seconds. It’s important to note that this entire section will only be displayed if a deadlock has occurred, otherwise, it will not populate at all.
As mentioned, this will only display the latest transaction. In order to see information on all deadlocks that have timed out in the past, the innodb_print_all_deadlocks option must be enabled. This will record all transactions as such in the mysqld error log. Instructions to set this up as follows:
1. Locate the my.cnf file and add innodb_print_all_deadlocks = 1
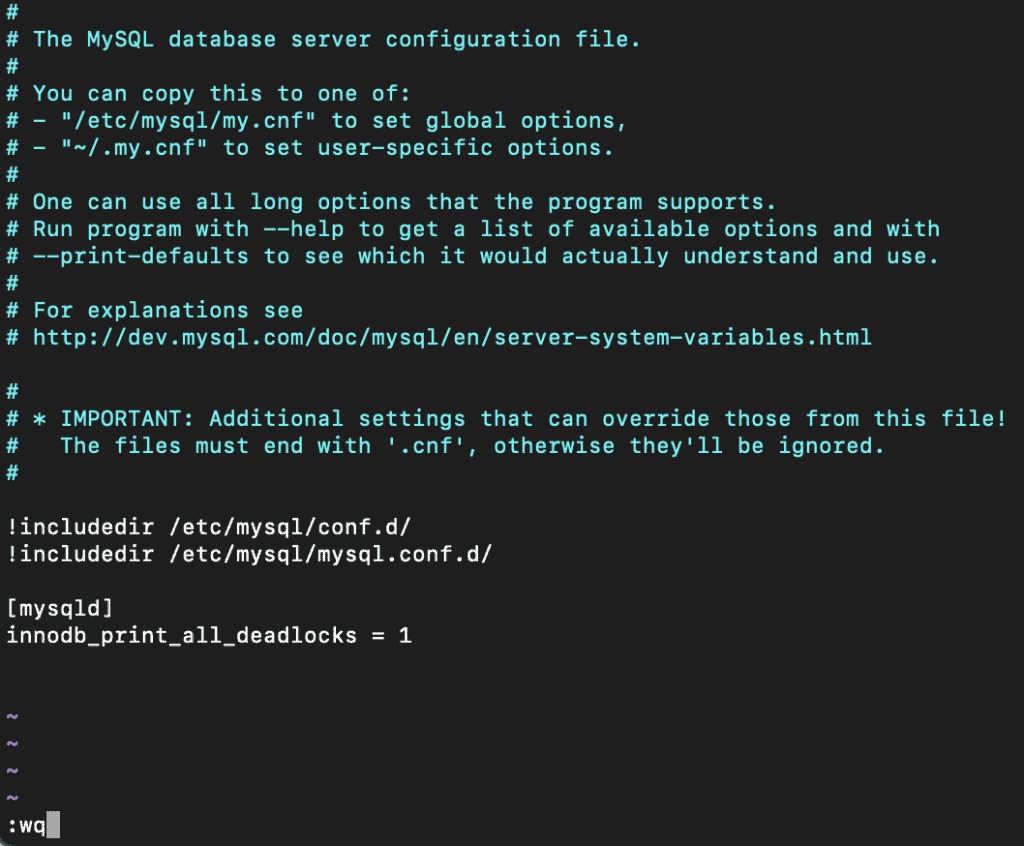
2. It is not necessary to restart MySQL, rather just set value = ON.
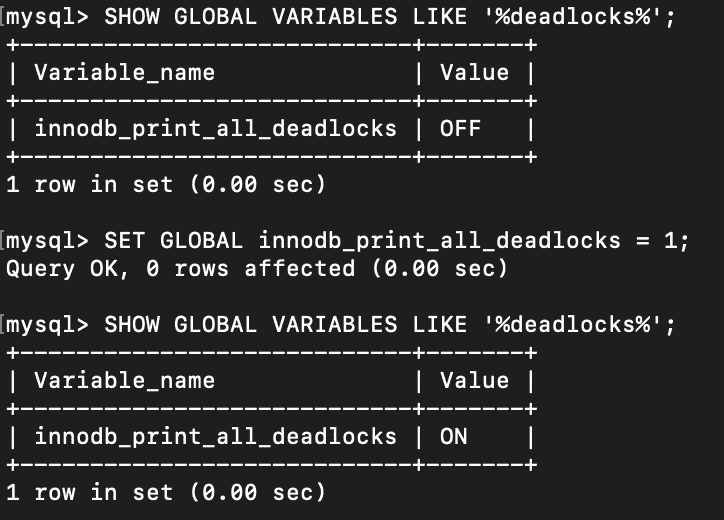
mysql> SET GLOBAL innodb_print_all_deadlocks = 1;Note: It’s recommended to disable this option after troubleshooting and debugging as it’ll greatly impact the growth of the error log, especially if deadlocks occur frequently.
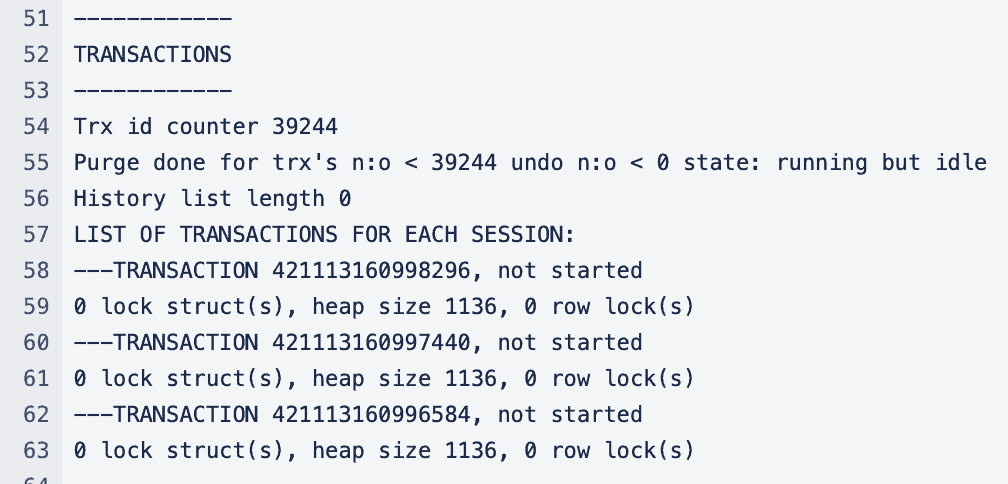
Following the DETECTED DEADLOCK section is TRANSACTIONS which can help identify and trace back the probable cause behind the deadlock. Information found under the engine status can help diagnose where to tune in the application to avoid these deadlocks.
Yet another valuable tool for troubleshooting is the InnoDB_TRX table which will populate information regarding any transaction executing using InnoDB in real-time. The output includes whether or not a lock occurred and the SQL query waiting to execute. This could be vital in finding conclusive evidence that the engine status could not provide.
SELECT * FROM INFORMATION_SCHEMA.INNODB_TRX\G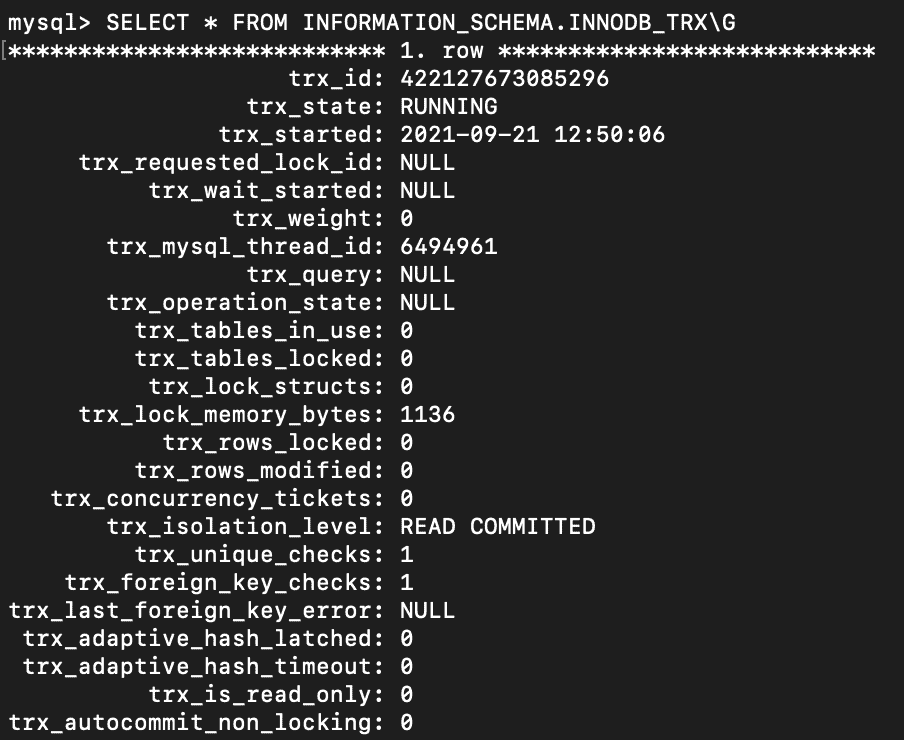
Troubleshooting deadlocks gets complicated as there’s no complete guide or solution to each one but there are multiple tools we can use to better understand why a deadlock happened thus minimizing the negative impact on the servers and preventing a serious issue from arising.
If a system lacks proper monitoring, it is possible that an extenuating problem caused by deadlocks can occur without notice and it’s important that we avoid disasters before they can happen. While deadlocked transactions appear in the error log, this can often be overlooked and forgotten as this would need to be checked on a regular basis. Fortunately, XTIVIA’s Virtual-DBA proactively monitors servers. Our monitoring system alerts our DBA’s of long running queries and idle app holding locks, amongst many other important metrics. This allows us to follow the deadlocks as they come and be prompt in investigating the problem queries.