Mtools is a third party tool suite that contains very easy to use utilities for troubleshooting or just gathering general knowledge about your MongoDB instance. These tools can be crucial when performance tuning, running a health check or examining log files.
You can find mtools here:
https://github.com/rueckstiess/mtools
In this article we are going to run through a few tools in the mtools suite that can you help you troubleshoot slow queries in MongoDB.
- mloginfo
- mplotqueries
- mlogvis
Mtools mloginfo
The most common use of this tool is to get a comprehensive view of a log that is easily readable.
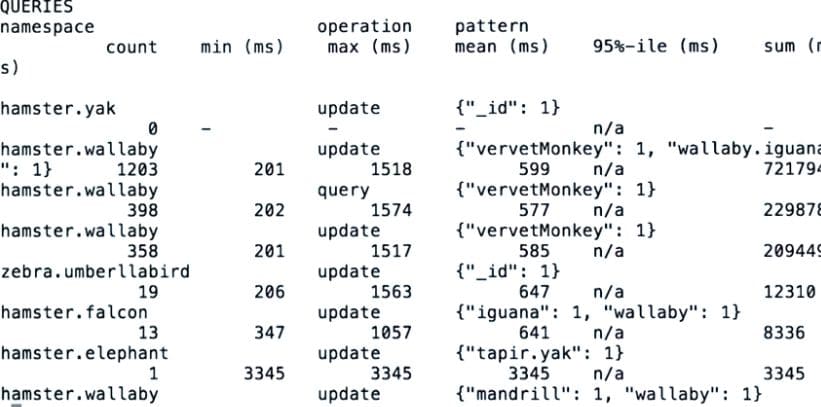
mloginfo –queries –no-progressbar server.log

This command will give us an output of all the queries in the log and the count of how many times the query was run. It will also give us a max/min/avg of the query time, pattern used and the total query time for that set of queries.
The mean column will give you a great idea of which queries could be experiencing non-index issues. If the query has been run 500 times and you have a mean response time of 500ms, you may be experiencing some configuration issues with your indexes.
mplotqueries
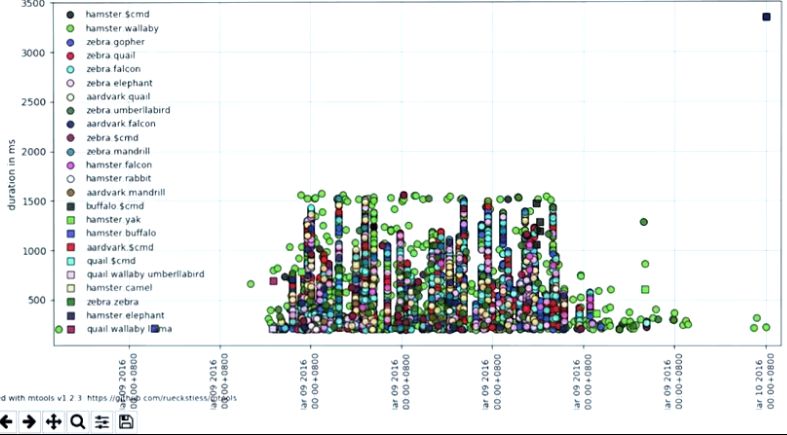
This allows you to plot information from your log file. This is a great way to visually analyze your log files and determine when and why you have slow running queries.
mplotqueries server.log

The y axis is the time in milliseconds that the query took to retrieve. The x axis is the time that the query was issued. You can zoom in on a certain area by drawing a box around a result set. You can look at the details of any particular query by clicking on it.
mlogvis
This is a graphical log file tool. It extracts information from your log file and allows you to export an html file that is viewable on your desktop browser. The advantage of this method compared to mplotqueries is that the recipient doesn’t need mtools to view the html file results. However the output is very similar to the look and function of mplotqueries.
mlogvis –no-browser server.log
This command will create the html file. You can then send this to your client or open it from your desktop on Windows. Opening the file will generate a similar view as mplotqueries and allow you to examine your slow queries, view details and determine where your problem areas are.
For more Mtools get help from a Virtual-DBA expert today!

