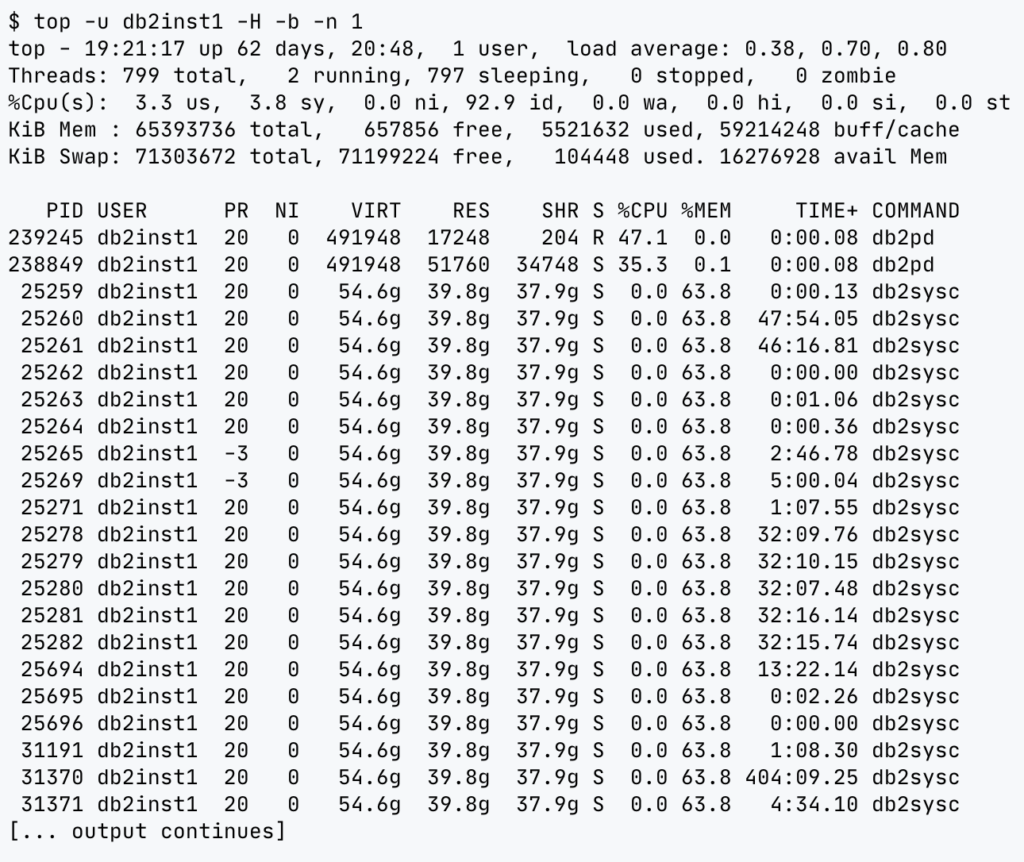
When monitoring CPU utilization on a Db2 server, each Db2 instance generally has a single db2sysc process (per database partition) consuming CPU on the server. The db2sysc process is made up of many threads. While it’s possible to see CPU utilization of each thread within the db2sysc process using top -H, this view is limited in its usefulness because each thread is shown only as “db2sysc”.

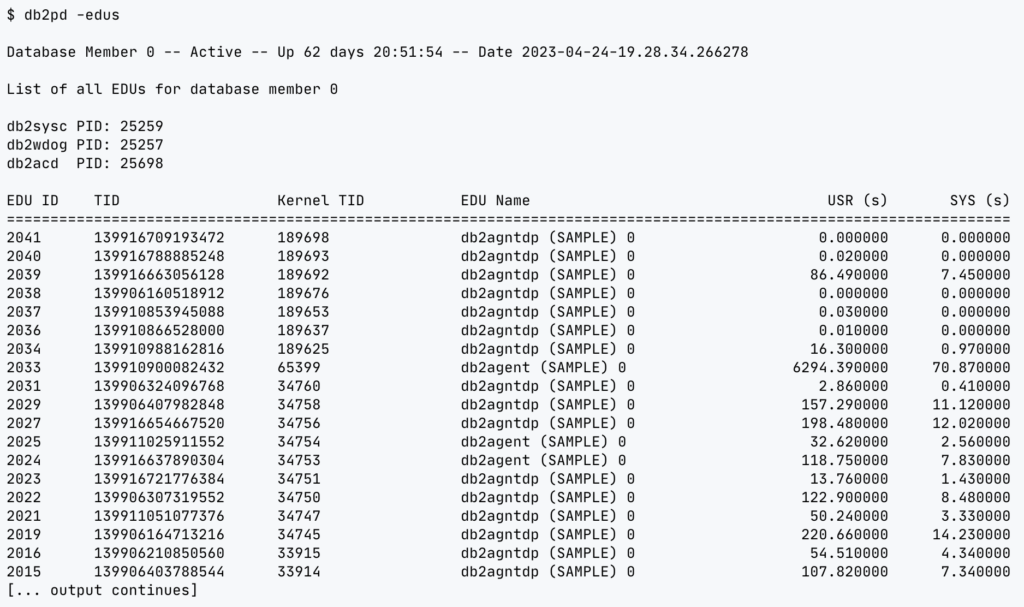
The db2pd utility provides a way to view what these threads are, using the actual Engine Dispatchable Unit (EDU) Names, and it includes information about how much CPU time each EDU has consumed:

Unfortunately, the CPU utilization information represents how much CPU time each EDU has consumed since each thread was started. This view does not make it easy to determine how much CPU the individual EDUs are consuming at any given time. It is possible to display which EDUs used the most CPU over a particular time using the `interval` option (for example, db2pd -edus interval=5), but this just produces additional columns showing the change in USR and SYS CPU time over the interval.
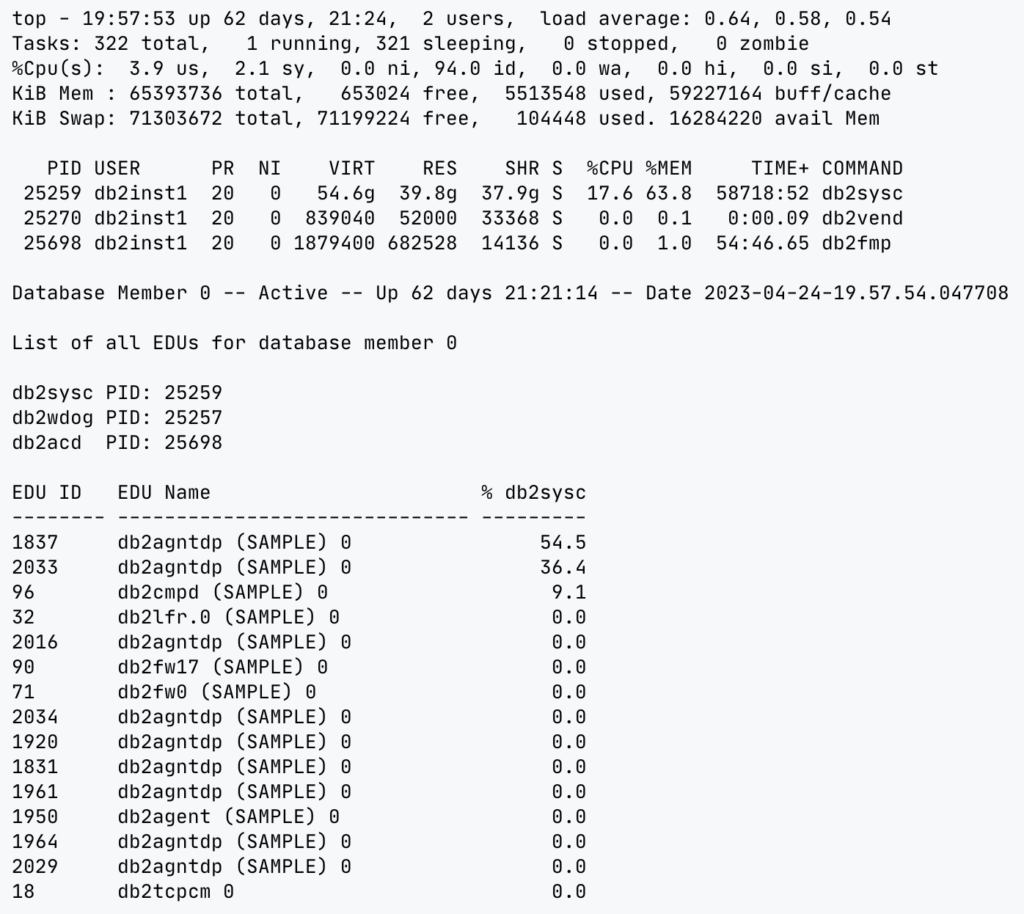
The db2pdtop.pl utility attempts to resolve these shortcomings by providing a top-like tool that calculates the %CPU utilization of the individual EDUs, and displaying the output in a top-like format. db2pdtop.pl uses similar command-line options as top, and displays CPU information about both the Db2 processes for the instance (as reported by `top`) and the EDUs within the db2sysc process:

This tool was particularly useful in a strange customer situation where a HADR takeover appeared to hang for multiple minutes. Top reported that the db2sysc process was consuming CPU, but using db2pdtop.pl revealed that the db2logmgr EDU was the culprit. This allowed us to investigate the log archiving setup further to understand what was causing the issue.
If you’d like to give this tool a try or learn about its command line options, it’s available for download on Github. Please contact us for more information!

