
SUMMARY:
Database Administrators can maximize the stability and efficiency of Oracle 19c environments by leveraging built-in diagnostic tools to pinpoint bottlenecks, automate query optimization, and enforce consistent execution plans.
- The Automatic Workload Repository (AWR) provides historical snapshots for system-wide trend analysis, while the Active Session History (ASH) delivers real-time session data to diagnose immediate wait events.
- The SQL Tuning Advisor automates remediation by analyzing high-load queries identified in AWR reports and recommending specific actions such as creating indexes, gathering statistics, or rewriting SQL code.
- SQL Plan Management (SPM) ensures long-term stability by capturing and persisting optimal execution plan baselines, which prevents performance regression even after database restarts or upgrades.
- Effective tuning requires a disciplined workflow that moves from identifying top timed events to manually loading verified plans into the cursor cache, provided the environment meets Enterprise Edition licensing requirements.
By integrating these utilities into a routine maintenance checklist, IT teams can shift from reactive troubleshooting to proactive performance management, ensuring critical systems remain fast and predictable.
Table of contents
Introduction
Oracle Database 19c offers a mature, stable platform with advanced tools for optimizing performance. As a DBA, mastering these built-in utilities — AWR, ASH, and SPM — is key to keeping your systems fast and efficient. In this blog, we’ll go step-by-step from analyzing top wait events to managing SQL baselines, supported by real commands and actionable DBA insights.
Understanding the Key Components
| Tool | Purpose |
| AWR (Automatic Workload Repository) | Captures performance statistics over time (snapshots). |
| ASH (Active Session History) | Provides session-level performance data in real time. |
| SQL Tuning Advisor (STA) | Recommends improvements for poorly performing SQLs. |
| SQL Plan Management (SPM) | Ensures plan stability using baselines. |
Diagnosing Performance Bottlenecks with AWR and ASH
Tip: Use AWR for system-wide analysis and ASH for real-time, session-level insights.
Automatic Workload Repository (AWR)
AWR captures snapshots of database activity at regular intervals, giving insight into CPU usage, I/O waits, and SQL performance over time. It’s ideal for historical analysis and identifying system-wide issues.
Example: Identifying Top Wait Events with AWR
If your database slows during peak hours, generate an AWR report to pinpoint the cause.
sqlplus / as sysdba
@$ORACLE_HOME/rdbms/admin/awrrpt.sql
You’ll be prompted to:
- Choose report type (HTML or TEXT)
- Specify snapshot range
- Enter a report name
Key Metrics to Check
Top 5 Timed Events
In Oracle Database Administration, the Top 5 Timed Events are the most significant wait events that consume database time, as reported by the Automatic Workload Repository (AWR). These events highlight where the database spends most of its time, helping DBAs identify performance bottlenecks.
SQL Ordered by Elapsed Time
SQL Ordered by Elapsed Time is a key section in the Automatic Workload Repository (AWR) report or similar performance tools (e.g., Statspack). It lists SQL statements consuming the most elapsed time during execution, helping DBAs identify resource-intensive queries that may cause performance bottlenecks.
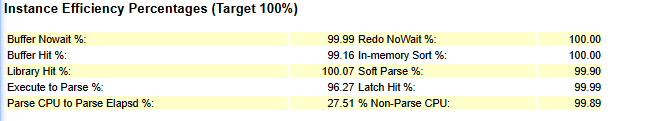
Instance Efficiency
Instance Efficiency is a section in the Automatic Workload Repository (AWR) report that provides key performance metrics indicating how efficiently the database instance uses its resources. These metrics help DBAs assess the database’s health and identify areas for optimization.
Instance Efficiency metrics are a snapshot of how well an Oracle database utilizes its resources. High ratios indicate an efficient system, while low ratios signal areas for improvement, such as memory configuration or query optimization. Regularly reviewing these metrics alongside other AWR sections (e.g., Top 5 Timed Events, SQL Ordered by Elapsed Time) ensures a proactive approach to maintaining optimal database performance.
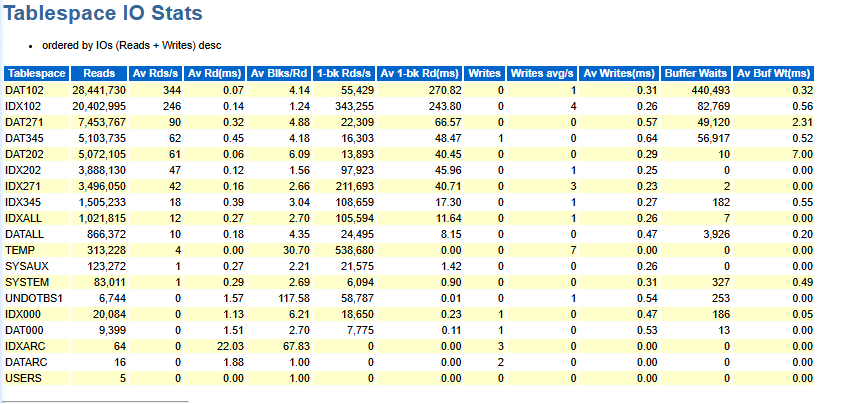
IO Stats
In Oracle Database Administration, I/O Stats (Input/Output Statistics) in the Automatic Workload Repository (AWR) report provide insights into the database’s disk I/O performance. These statistics help DBAs identify I/O bottlenecks, optimize storage configurations, and improve overall database performance. By analyzing these metrics, DBAs can optimize query performance, balance I/O workloads, and ensure efficient storage usage. Combine I/O Stats analysis with other AWR sections.
Active Session History (ASH)
Using the Active Session History, you can examine and perform a detailed analysis on the current data in the V$ACTIVE_SESSION_HISTORY and the past data in the DBA_HIST_ACTIVE_SESS_HISTORY view. The ASH report is smaller than the AWR report and will provide db/instance details for a short period of time. An ASH report covers a much shorter period of time (e.g., 5 min) than an AWR report (e.g., 30 min or 1 hour).
Major ASH report sections are:
- Top User Events
- Top Background Events
- Top Cluster Events
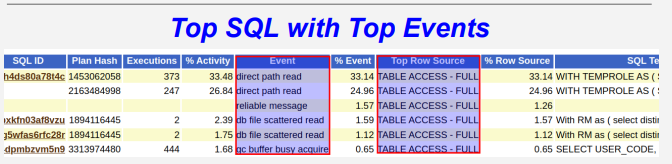
- Top SQL with Top Events
Ways Of Gathering ASH
Note: For RAC environments, collect ASH data from all instances simultaneously for better correlation.
Using ORADEBUG
ASHDUMP needs to be collected DURING the time of the issue
In case of collecting from RAC, Gather ASH Dumps from ALL database instances at approximately the same time.
SQL> oradebug setmypid;
SQL> oradebug unlimit;
SQL> oradebug dump ashdump 5;
SQL> oradebug tracefile_name;
Using ashrpt.sql or Enterprise Manager
SQL> @?/rdbms/admin/ashrpt
	Enter value for report_type:  HTML or TEXT [ HTML is default ]
	Enter value for begin_time:
		Defaults to -15 mins
		To specify absolute begin time: [MM/DD[/YY]] HH24:MI[:SS]
		To specify relative begin time: (start with '-' sign) -[HH24:]MI
	Enter value for duration: Default is till current time
	Enter value for report_name:
Using v$active_session_history
SELECT event, COUNT(*) AS wait_count
FROM v$active_session_history
WHERE sample_time > SYSDATE - (5/1440)
GROUP BY event
ORDER BY wait_count DESC;
Identify Top SQL IDs by Waits
SELECT sql_id, event, COUNT(*) AS samples
FROM v$active_session_history
WHERE session_state = 'WAITING'
GROUP BY sql_id, event
ORDER BY samples DESC FETCH FIRST 10 ROWS ONLY;
Tip: Combine ASH data with AWR for both macro (system-wide) and micro (session-level) tuning insights.
SQL Tuning Advisor: Automating SQL Optimization
Once you’ve identified a problematic SQL ID from AWR or ASH, use the SQL Tuning Advisor to generate actionable recommendations.
DECLARE
  tname VARCHAR2(30);
  tid   NUMBER;
BEGIN
  tname := DBMS_SQLTUNE.CREATE_TUNING_TASK(
              sql_id => 'b9p45hkcx0pwh',
              scope  => 'COMPREHENSIVE',
              time_limit => 60,
              task_name  => 'sql_tune_task1');
  DBMS_SQLTUNE.EXECUTE_TUNING_TASK(task_name => 'sql_tune_task1');
END;
/
Tip: The SQL Tuning Advisor may suggest index creation, SQL rewriting, or gathering optimizer statistics.
Check the status:
SELECT task_name, STATUS FROM dba_advisor_log WHERE task_name LIKE 'sql_tune_task1';Execute Tuning task:
EXEC DBMS_SQLTUNE.execute_tuning_task(task_name => 'sql_tune_task1');Get the Tuning Advisor report:
set long 65536
set longchunksize 65536
set linesize 100
SELECT DBMS_SQLTUNE.REPORT_TUNING_TASK('sql_tune_task1') FROM dual;
Interpreting SQL Tuning Advisor Output:
The output typically includes:
| Recommendation | Description | Action |
|---|---|---|
| Statistics | Suggests gathering optimizer statistics for stale or missing objects. | Use DBMS_STATS.GATHER_TABLE_STATS. |
| Indexing | Recommends new indexes that can reduce I/O. | Create only after cost-benefit analysis. |
| SQL Profile | Proposes creating a SQL Profile to improve optimizer estimates. | Accept using DBMS_SQLTUNE.ACCEPT_SQL_PROFILE. |
| Rewriting | Suggests modifying SQL text for better performance. | Apply manually in code. |
Tip: Always validate SQL Profile or Index recommendations in a test environment before implementing in production.
Managing Execution Plans with SQL Plan Management (SPM)
How SQL Plan Baselines Work:
When a SQL statement is executed, the optimizer generates an execution plan. If a plan is captured as a baseline, subsequent executions of that statement will try to use the same plan. If a new, better plan is found, it can be evolved into the baseline.
SQL Plan Management (SPM) Persistence:
SQL Plan Baselines are persistent across database restarts. Once captured, they remain stored in the data dictionary under SYS.SYS_SQL_PLAN_BASELINES, ensuring the same plan is used consistently even after shutdowns or instance failures.
Enable Automatic SQL Plan Capture:
ALTER SYSTEM SET "optimizer_capture_sql_plan_baselines" = TRUE SCOPE=BOTH;This automatically captures frequently executing and resource-intensive SQL plans.
Manually Load a Good Plan:
DECLARE
  plans_loaded  PLS_INTEGER;
BEGIN
  plans_loaded := DBMS_SPM.load_plans_from_cursor_cache(
                    sql_id => 'b9p45hkcx0pwh',
                    plan_hash_value => 1234567890,
                    fixed => 'YES',
                    enabled => 'YES');
END;
/
Note: Manually loading a good plan is helpful when you’ve verified a stable execution plan and want to make it permanent.
DBA Performance Tuning Checklist
| Step | Task | Tool/Query |
| 1 | Review top timed events | AWR report |
| 2 | Check real-time session waits | ASH query |
| 3 | Identify high-load SQL | AWR → SQL Ordered by Elapsed Time |
| 4 | Run SQL Tuning Advisor | DBMS_SQLTUNE |
| 5 | Apply or evolve SQL baselines | DBMS_SPM |
| 6 | Monitor adaptive optimization | Optimizer parameters |
| 7 | Validate improvement | AWR before/after comparison |
Licensing and Disclaimer
The following Oracle features require Enterprise Edition + Diagnostics and Tuning Pack:
AWR (Automatic Workload Repository)
ASH (Active Session History)
SQL Tuning Advisor
SQL Profiles
Disclaimer: Before using or testing these features, always confirm licensing requirements with your Oracle Representative. Unauthorized use in non-licensed environments may violate Oracle licensing agreements.
Conclusion
Performance tuning in Oracle 19c is about visibility, consistency, and control. By combining AWR, ASH, and SQL Plan Management, DBAs can identify bottlenecks, tune SQL effectively, and ensure stable performance across environments.
With these tools and best practices, you can transform performance issues into optimization opportunities, ensuring your Oracle databases run efficiently and predictably.
For questions, please contact us.